Select districts
How we do it
The first step consists of giving a coefficient to each column category (social, environmental and economic). The sum of this weight should be 1; therefore, a higher weight will represent that wellbeing is favoured by that group of columns. For example, a coefficient of 0.5 for social, 0.2 for environmental, and 0.3 for economic means that the columns within the social category have a greater impact than the economic and environmental categories. The following formula will give the weight of each column.
\(coeff_{social}+coeff_{environmental}+coeff_{economics}=1\)
Once this value has been defined, the next step is to give a weight to each column within the category. This weight will be given in a range from 0 to 10, whereby 0 means that it contributes nothing to wellbeing and 10 means that it contributes as much as possible to wellbeing within the weight of this category.
\(∑_{i=1}^\text{Nº of columns} coeff_{col_i}=1\)
\(coeff_{soc\_col_i}=(weight_{col_{social_i}})/(\text{Nº of social cols})*coeff_{social}\)
\(coeff_{env\_col_i}=(weight_{col_{env_i}})/(\text{Nº of environmental cols})*coeff_{environmental}\)
\(coeff_{ecs\_col_i}=(weight_{col_{economics_i}})/(\text{Nº of economics cols} )*coeff_{economics}\)
Where, \(coeff_{soc\_col_i}\), \(coeff_{env\_col_i}\), \(coeff_{ecs\_col_i}\) are the coefficients that represent the importance of each column in well-being. \(weight_{col_{social_i}}\), \(weight_{col_{env_i }}\), \(weight_{col_{economics_i }}\) are the weights defined by a user/researcher set to each column, ranging from 0 to 10, given the importance of each column based on scientific knowledge. \(coeff_{social}\), \(coeff_{environmental}\), \(coeff_{economics}\) are another coefficient previously set by the user/researcher that represents the importance that each category affect to wellbeing. In case it is desired that all three categories affect the same, it is only necessary to enter the same value in all three categories.
Once the coefficients representing the weight of each wellbeing column are obtained, the next step consists of multiplying this coefficient by the corresponding column. The value of this column has been previously normalised between 0 and 1 for columns that have a positive effect and between 0 and -1 for columns that have a negative impact. The following images shows the dataset before/after this stage.


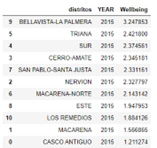
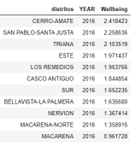
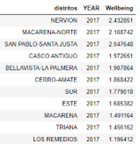
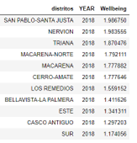
Therefore, the wellbeing will be calculated as the sum of all columns that have been previously multiplied by the coefficient. An example of wellbeing with a random coefficient from 2015 to 2018 is presented in the next figure.


